
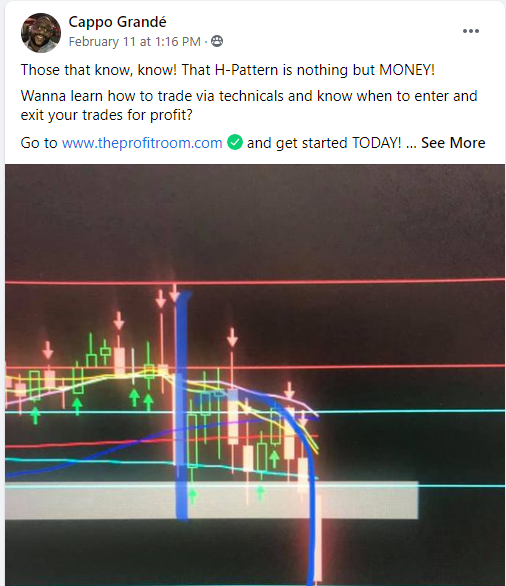
We find great success when we recognize this particular pattern before it even occurs. It’s called the “h” pattern, it’s rarely used amongst other traders, however The Profit Room’s team can spot this pattern on any time frame. It’s our bread and butter for easy money making. In early 2014 The founders of The Profit Room made the h pattern a trend amongst many traders that crossed their path.
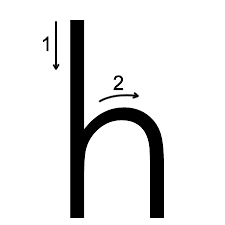
The pattern occurs when the stock has a steep or sudden decline followed by a very weak bounce (all the following candles are inside bars) As the bounce begins to fail, the price formation resembles a lower-case “h”.
Many technical traders will trade any pattern based on a break. As in the break of support. We like to enter a trade before the break of support. It’s all in anticipation! With the h pattern, you will enter the short at the top/curve of the highs, with a stop way above the highest candle. As the stock begins to drop, you can add to your position. The next stage is when the stock actually breaks support– your next add will be below support, therefore maximizing the profit potential.
Our Students have the eye for it, which means our teachings are golden! And our Students are trained to react ,attack and profit in that exact order. The “h” pattern can be found in any market, Stocks, Futures, Forex, Crypto….. Below our Student posted a chart of ES Futures (E-mini S&P 500 Futures)
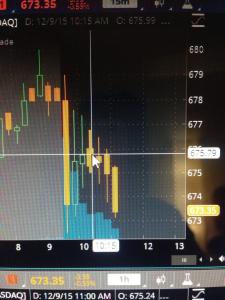
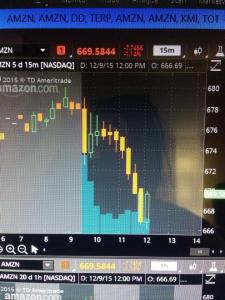
Below Are Charts From 2015
You are looking at AMZN chart- right where the arrow points, our entry was at the tail of the candle, with the stop above the second candle to the left of it. If you are familiar with candle stick analysis, you will understand that there are sellers at the wicks of those candles. Our Candle Stick Analysis Course is like no other! We get rave reviews as we are able to break down simple concepts into elementary lingo.
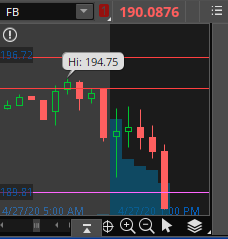
2020 Charts
FB h pattern
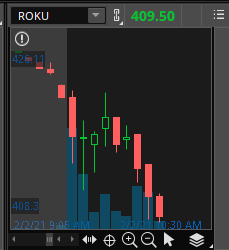
2021 Charts
ROKU h pattern
Preferably, a daily chart “h” pattern will result in substantial gains. We are talking about a Major move.